2023 Annual Air Quality Review
Air pollution rebounds as normalcy resumes, solutions urgently needed
Each year, Clean Air Network (CAN) reviews data from the Environmental Protection Department’s air quality monitoring stations in the previous year to analyse local pollution trends. The year of 2023 marks the end of the pandemic and society’s return to normalcy, which unfortunately brought about a rebound in air pollution. In particular, the annual average concentration of ozone reached record high.
Hong Kong’s air quality has consistently fallen short of the World Health Organization’s (WHO) safe standards. The rebound in pollution over the past year has further widened the gap, underscoring the pressing need for the HKSAR Government to adopt stronger measures to improve air quality after the pandemic to safeguard public health and well-being.
1. Rebound in air pollution creates greater health hazards
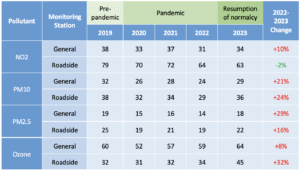
During the pandemic, Hong Kong saw an improvement in air quality, as the annual average concentrations of nitrogen dioxide (NO2), PM10 and PM2.5 recorded at general and roadside monitoring stations achieved historic lows in 2022. However, air pollution worsened in 2023, in which the annual average concentration of most of the major pollutants increased, getting close to pre-pandemic levels in 2019 (see Table 1).
Compared with the previous year, many of the pollutants had double-digit percentage increases, with the largest being in roadside ozone concentration (+32%). Only roadside NO2 concentration recorded a slight decrease (-2%).
Table 1: Annual average concentration of major air pollutants (μg/m3)
The WHO established safe standards (WHOAQGs) for air pollution based on its impact on human health, which Hong Kong’s air quality has not been able to meet. It is estimated by the Hedley Environmental Index by the School of Public Health of the University of Hong Kong that unsafe air pollution leads to about 3,500 premature deaths every year in Hong Kong.
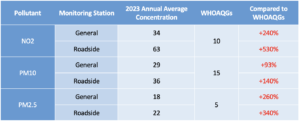
Hong Kong’s air quality deteriorated in 2023, pushing it further away from WHOAQGs (see Table 2). The highest exceedance was the annual average roadside NO2 concentration (+530%), followed by roadside PM2.5 concentration (+340%).
Table 2: Comparison between annual average concentration of air pollutants and WHOAQGs
2. Roadside NO2 dropped slightly but still surpass local and WHO standards
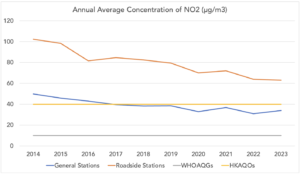
The annual average roadside NO2 concentration was 63 µg/m3, a minor decrease of 2% compared with the previous year, still exceeding the Hong Kong Air Quality Objectives (HKAQOs) and WHOAQGs (see Chart 1).
Roadside NO2 concentration mostly reflects transport emissions. The increase in the number of electric vehicles in recent years may have contributed to the reduction in roadside NO2 concentration. Meanwhile, the NO2 concentration at general stations rose by 10% to 34 µg/m3.
Chart 1: Annual average concentration of NO2
3. PM10, PM2.5 bounced back sharply
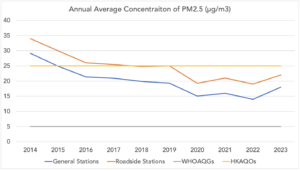
The annual average concentrations of PM10 and PM2.5 recorded at general and roadside stations rebounded immensely, with increases ranging from 16% to 29%, getting close to pre-pandemic levels (see Charts 2 and 3).
Concentration of PM2.5, a group 1 human carcinogen, increased to 22 µg/m3 at roadside stations, exceeding WHO standards by 2.6 times, while the general PM2.5 concentration in urban areas increased by nearly 30% to 18 µg/m3, exceeding WHO standards by 3.4 times, posing a serious threat to public health.
Chart 2: Annual average concentration of PM10
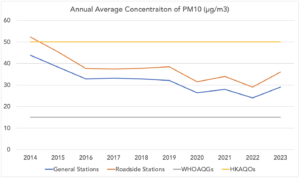
Chart 3: Annual average concentration of PM2.5
4. Ozone surged to historic high
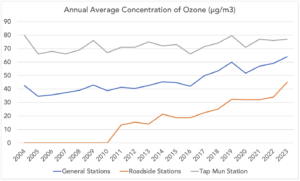
As the rising trend of ozone concentration continues in 2023, the annual average concentration at general stations rose to 64 µg/m3 by 8%, and that at roadside stations increased to 45 µg/m3 by a remarkable 32%, both of which are the highest levels ever recorded at EPD stations (see Chart 4).
Chart 4: Annual average concentration of ozone
5. North-western districts suffer worse pollution, ozone penetrates urban areas
The 15 general monitoring stations across Hong Kong serve as indicators of community-level air quality. Generally speaking, the western and northern parts of Hong Kong have worse air quality, such as Tuen Mun, Yuen Long and North District. In particular, Tuen Mun station recorded the highest annual average concentrations of NO2, PM10 and PM2.5 (see Table 3). Affected by a wide range of emission sources, including road traffic, navigation, power plants and regional emissions, Tune Mun has been one of the most polluted districts in Hong Kong.
It should be noted that Tap Mun station, which is away from urban emission sources, usually has the highest ozone concentration among the stations, reflecting that ozone pollution is mainly a regional problem. Nonetheless, last year, the ozone concentration at Southern station (83 μg/m3) exceeded that at Tap Mun, making it the highest among all districts, while that at Eastern station also came close to that at Tap Mun. Apparently, ozone pollution in urban areas has intensified, indicating that this is no longer solely a regional problem, local solutions are also in need.
Table 3:Annual average concentrations of major pollutants by district (μg/m3)

6. Policy recommendations
1) Expedite transition to green transport
Roadside air pollution remains at dangerous levels, but the percentage of electrification in the commercial vehicular fleet, which is the major source of pollution, is currently as low as less than 1%. Regarding public buses and taxis, the government vows to provide a roadmap for their green transition within the first half of this year. Yet for other commercial vehicles, such as goods vehicles and public light buses, a roadmap will not be provided until 2025. CAN believes the government should swiftly lay down a roadmap for the transition of all commercial vehicles, set a deadline for new registrations of fuel-propelled commercial vehicles, and negotiate with operators pathways to accelerate the change, such as offering subsidies.
Other sustainable transport measures should also be implemented, including electronic road pricing, expansion of low emission zones, reducing the number of private cars, enhancement of pedestrian and cycling infrastructure.
2) Emission reduction in maritime transport
Navigation is another chief pollution source in Hong Kong. While CAN anticipates the action plan for green methanol bunkering for local and ocean-going vessels coming up this year to alleviate pollution, other green fuel options, such as hydrogen and ammonia, should also be investigated so as to catch up with global trends and offer diversification to operators, ultimately benefiting the long-term development of Hong Kong’s shipping industry.
In addition, the government schedules to publish an action plan for the development of cruise tourism in the first half of this year, but the latest findings of CAN suggests that cruise ships docked at Kai Tak Cruise Terminal, in close proximity to residential areas, have been emitting hazardous levels of NO2, which can rise to nearly 9 times of WHO standards. CAN urges the government to develop shore power facilities at cruise terminals and require cruise ships berthing in Hong Kong to use shore power.
3) Immediate action needed to curb ozone pollution
Ozone pollution is expected to deteriorate due to the rising number of electric vehicles, which will reduce emissions of nitric oxide (NO) to scavenge ozone, and favourable conditions for ozone formation created by rising temperatures. As such, local and regional solutions to reduce ozone pollution should be formulated as soon as possible.
4) Tighten AQOs to WHO standards
The public consultation of the new round of AQOs review was completed last year by the Environment and Ecology Bureau; however, the proposed amendments still fall short of WHO standards. CAN believes that the AQOs should be tightened to meet WHOAQGs in order to protect public health and promote more effective pollution reduction measures.
