2021 Annual Air Quality Review
Resurgence of Air Pollution Pushing Hong Kong Further Away from WHO Standards Roadside NO2 Exceed by 620%
Clean Air Network (CAN) analyzed the air quality data in 2021 from the Environmental Protection Department and concluded that air pollution worsened, compared to the previous year, as social distancing measures had been relaxed in most time of the year. Public health was therefore at risk – it is estimated that air pollution in 2021 resulted in 1,329 premature deaths and a total economic loss of 15.8 billion Hong Kong dollars.
World Health Organization (WHO) tightened its air quality guidelines in 2021, lowering the recommended levels of air pollutants. The concentrations of major air pollutants in Hong Kong in 2021 immensely exceeded the new WHO standards – the most serious being roadside NO2 concentrations, exceeding by 620%, while roadside PM2.5 concentrations exceeded by 320%. CAN urges the government to accelerate the implementation of zero emission public transportation to improve roadside air quality.
1. Worsening Air Pollution Hardly Meets WHO Standards
1.1 Rising Levels of Major Pollutants Increased Social Costs
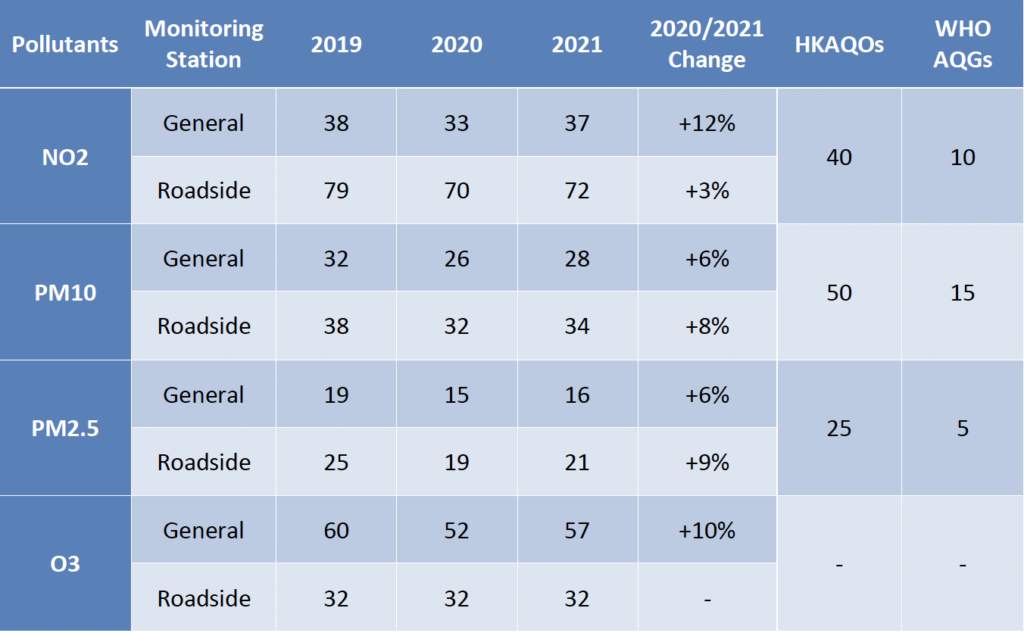
The annual average concentration of major pollutants, including nitrogen dioxide (NO2), respirable suspended particulates (PM10), fine suspended particulates (PM2.5), and ozone (O3), all increased in 2021, compared to 2020 (see Chart 1).
As the COVID-19 pandemic broke out in 2020, transportation was reduced because of social distancing measures such as suspension of classes and remote working, resulting in a drop in the level of air pollution. In 2021, as those measures were relaxed, the level of air pollution bounced back, though yet to reach that in 2019 before the pandemic. However, if the government does not take immediate action to curb such rising trend, public health will be under threat.
The rise of air pollution level increased health and economic costs in society (see Chart 2). The School of Public Health of the University of Hong Kong estimated that in 2021 the adverse health impact brough by air pollution had led to 1,691,209 doctor visits, 98,451 hospital bed days, and 1,329 premature deaths. A total economic loss of 15.8 billion HKD had also been inflicted.
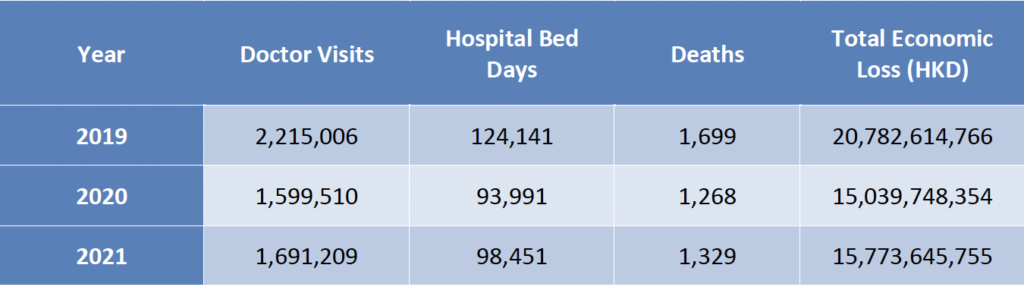
(Source: Hedley Environmental Index by School of Public Health of the University of Hong Kong)
1.2 Roadside NO2 Surpassing WHO Standards by 620%
WHO tightened its air quality guidelines (AQGs) in 2021. Meanwhile, the new Hong Kong Air Quality Objectives (HKAQOs) came into effect on 1st January 2022, which was also tightened but still more relaxed than WHO AQGs.
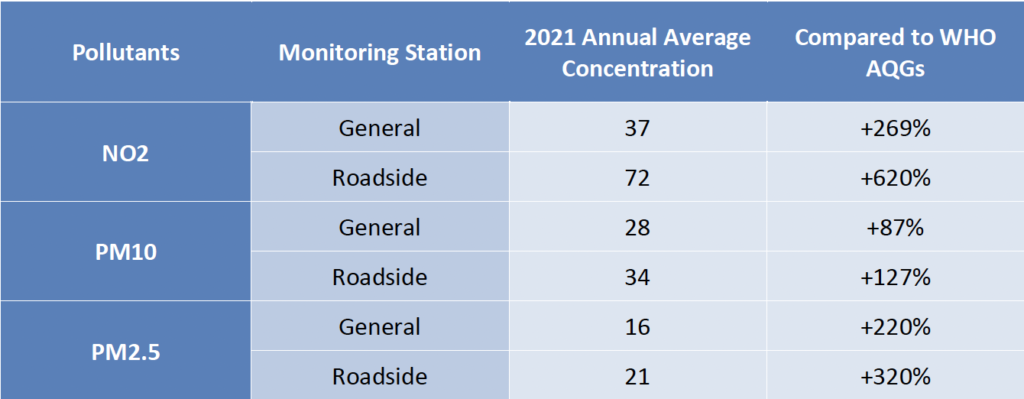
While the levels of air pollutants increased in 2021, they were still able to meet the new HKAQOs; however, they strayed further away from the new WHO AQGs (see Chart 3).
The levels of annual average concentration of major pollutants exceeded WHO AQGs. The greatest difference was recorded in the level of roadside NO2, which exceeded by 620%. Roadside PM2.5 also exceeded by 320%.
2. Zero Emission Transportation Urgently Needed as NO2 Level Increased
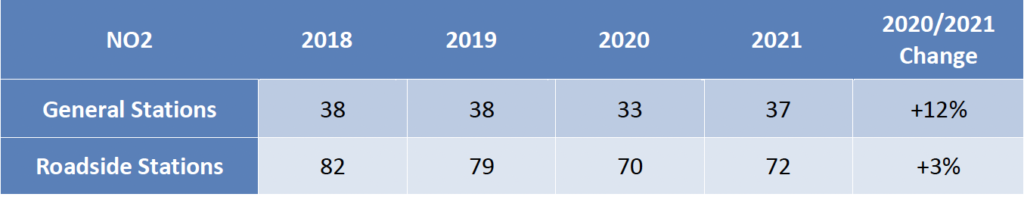
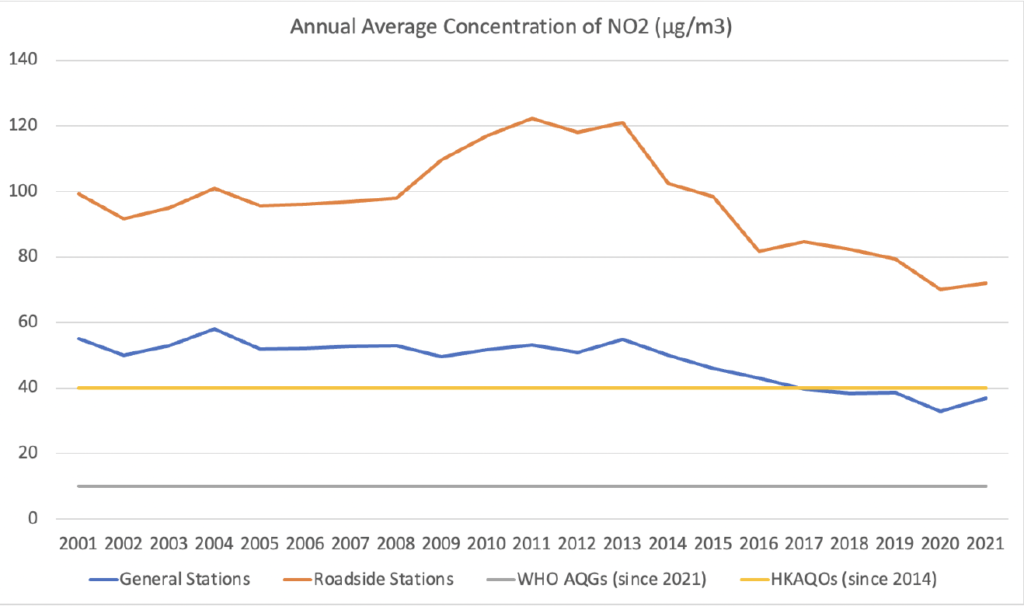
The major source of NO2 is car emissions. Over the past 10 years, the level of NO2 concentration has a decreasing trend, but it rose again in 2021 (see Graph 1). The annual average concentration of NO2 was 72 μg/m3, which rose by 3% compared to 2020 and is 620% higher than the WHO standard (10 μg/m3). General stations also recorded an annual average level of NO2 concentration that is 12% higher than that of 2020 – 37 μg/m3, 269% higher than the WHO standard.
Commercial vehicles including buses, trucks, and minibuses contributed to over 90% of the total emission of NOx of all vehicles in Hong Kong. CAN advocates the government to lay down a concrete plan for the implementation of zero emission public transport in order to improve roadside air quality and public health. As roadside air pollution intensified in 2021, it is necessary for the government to take immediate action.
3. Ozone Level Second Highest in 20 Years
3.1 Ozone Level Rose by 10%
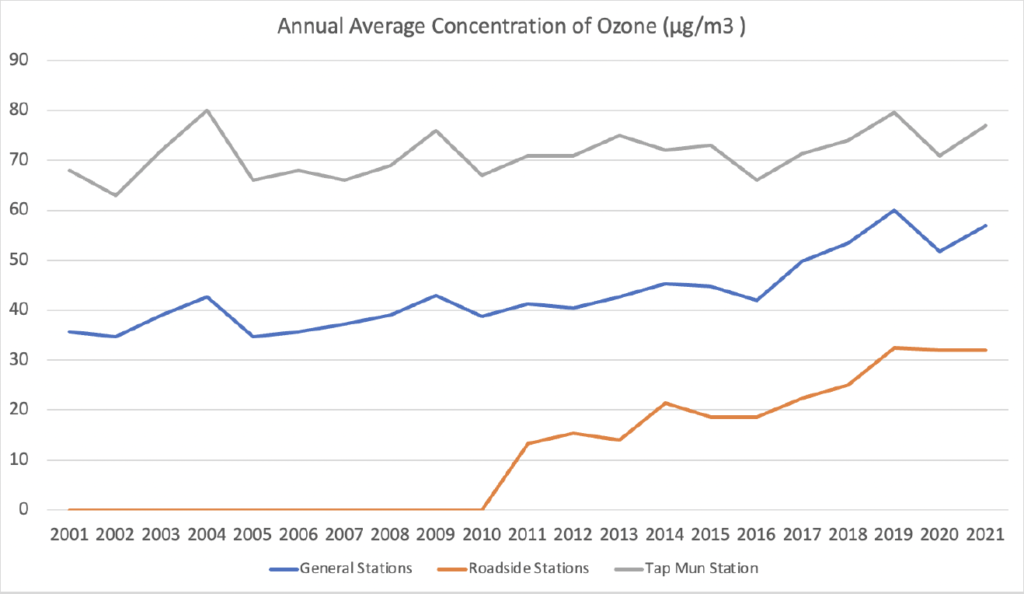
In 2021, the annual average concentration of ozone recorded in general monitoring stations was 57 μg/m3, increased by 10% compared to 2020 and marked the second highest point over the past 20 years. Roadside annual average concentration of ozone remains was 32 μg/m3, same as that in 2019 and 2020, which is the highest on record.
Tap Mun station had the highest annual average level of ozone concentration – 77 μg/m3, 8% higher than the previous year and also the second highest in 20 years, only lower than 80 μg/m3 recorded in 2004 and 2019.
3.2 Roadside PM2.5 and PM10 Increased by 9% and 8%
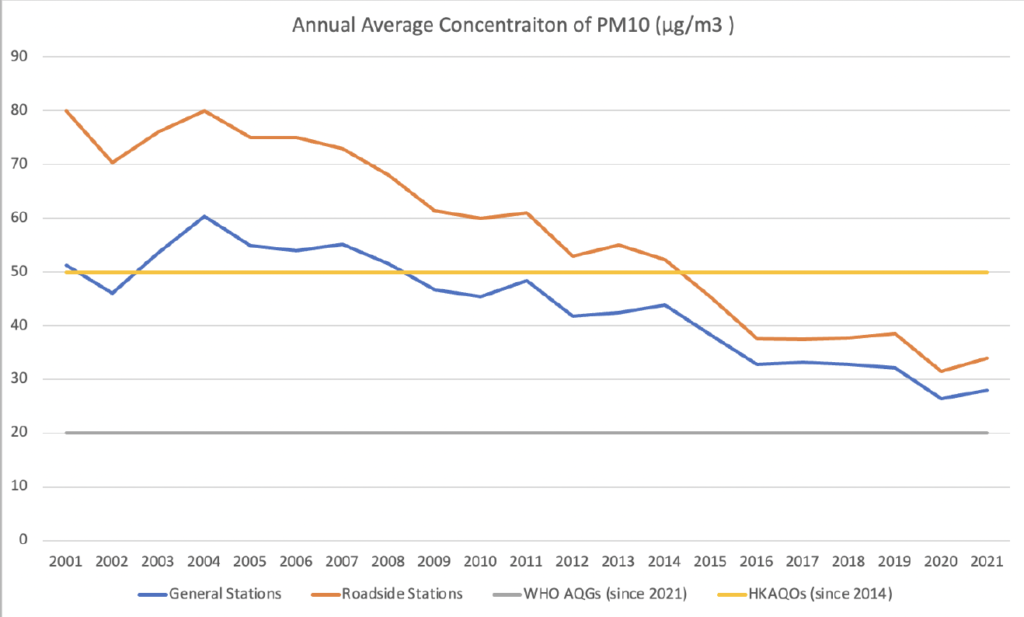
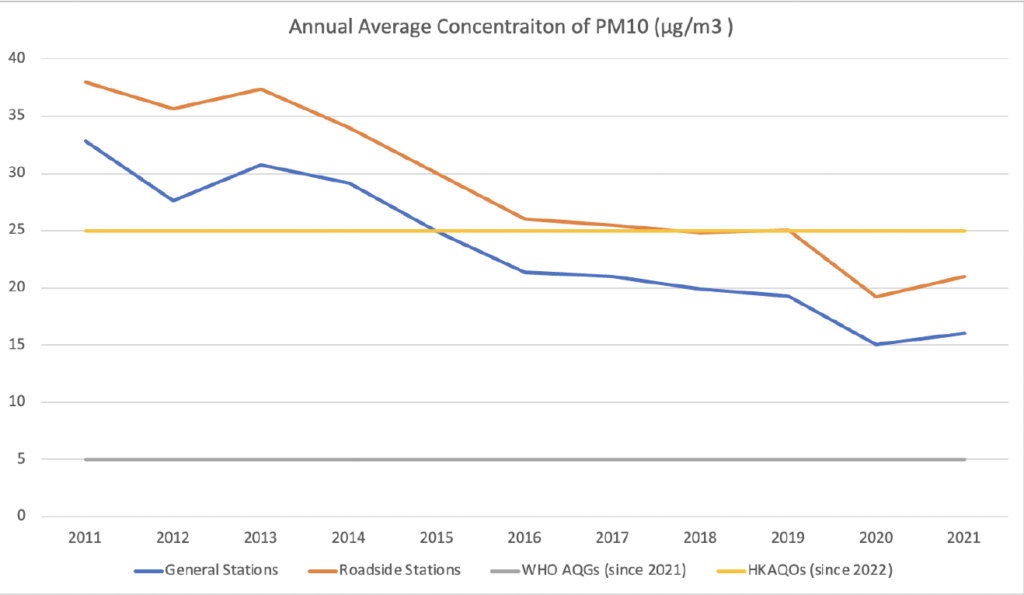
The annual average concentration levels of PM10 and PM2.5 has been gradually dropping in recent years but bounced back in 2021 (see Charts 3 & 4). Roadside PM2.5 annual average concentration was 21 μg/m3, which increased by 9% (see Chart 1).
Roadside PM10 concentration level was 34 μg/m3 on average, rose by 8%, while that recorded at general stations was 28 μg/m3, also rose by 8%. For PM2.5, average annual concentration at general stations was 16 μg/m3, increased by 6%.
In 2021, the levels of PM10 and PM2.5 were lower than the requirements of HKAQOs, but remains significantly higher than the new WHO standards.
4. Kwai Chung and Tuen Mun Recorded Worst Air Quality
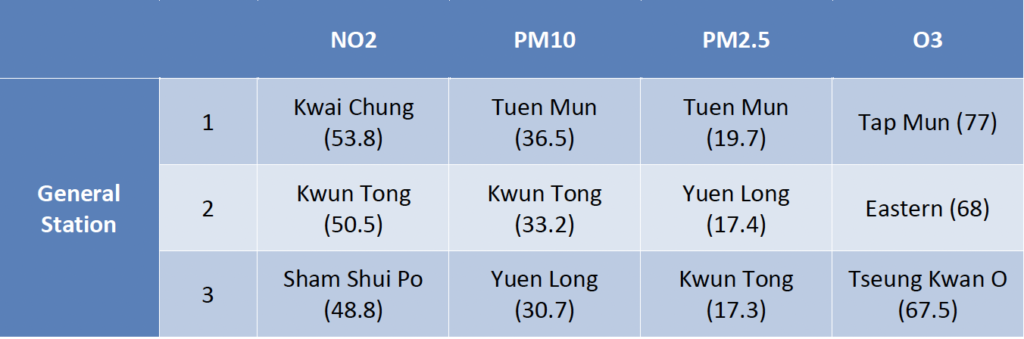
Among the 15 general air quality monitoring stations in Hong Kong, Kwai Chung station recorded the highest annual average NO2 concentration of 53.8 μg/m3. The highest annual average concentrations of PM10 and PM2.5 were recorded at Tuen Mun station, which were 36.5 μg/m3 and 19.7 μg/m3 respectively (see Chart 5).
Yuen Long station had the largest increase in NO2 annual average concentration – from 32 μg/m3 to 41 μg/m3, which is a 28% increase. PM10 concentration rose the most in Kwai Chung – from 23 μg/m3 to 27 μg/m3, increased by 17%. PM2.5 increased the most in Tung Chung – form 14 μg/m3 to 17 μg/m3, increased by 20%.
Eastern station had the second highest annual average level of ozone concentration, as well as the largest increase. It rose by 33% from 51 μg/m3 to 68 μg/m3.
Policy Recommendations
CAN suggests the government to take the following actions to improve air quality in Hong Kong:
1. Accelerate Full-scale Adoption of Zero Emission Mobility
As the annual average concentration of roadside NO2 and PM2.5 exceeded WHO guidelines by 620% and 320% respectively, it is essential for the government to take swift action to reduce emissions from vehicles.
Commercial vehicles, such as buses, trucks, minibuses and taxis, account for only around 20% of all the vehicles in Hong Kong, but they contributed to over 90% of the total emission of NOx of all vehicles in the city. CAN has been working on educating the public on the necessity of zero emission mobility and urging the government to make solid plans for its implementation. Currently the government is planning to set out a timeline for the adoption of zero emission commercial vehicles in 2025. CAN believes the government should act sooner, immediately lay down clear goals and provide the necessary resources to bring about the elimination of diesel vehicles as soon as possible.
2. Implement Actions Stated in “Clean Air Plan for Hong Kong 2035”
The government issued the “Clean Air Plan for Hong Kong 2035” in June 2021, setting a goal of improving the city’s air quality to a level on par with major international cities before 2035. It has also outlined actions and strategies, such as green transport, pedestrian-friendly and bicycle-friendly policies, and comprehensive emissions reduction, for achieving such a goal. In view of the air quality in 2021, which is far from reaching global standards, CAN believes that the government should act faster to take the actions stated in the plan to curb pollution.
3. Tighten AQOs to Meet WHO Standards
The new Hong Kong Air Quality Objectives came into effect this year, yet it is far from the revised WHO guidelines. The goal of CAN is to have Hong Kong’s air quality meeting WHO standards – we urge the government to further tighten the AQOs, so as to protect public health.
4. AQOs Review should be Open and Transparent
The Air Pollution Control Ordinance states that the AQOs should be reviewed once every 5 years. Nonetheless, it takes more than 5 years for the revised AQOs to be in force. For instance, the latest AQOs came into effect on 1st January 2022, but the last time that the AQOs were being revised was in 2014.
The next periodic review will be completed in 2023 – CAN demands it to be open and transparent, involving all stakeholders in the process. The ordinance should also be revised so that the revised AQOs should be in force every 5 years.
5. Solid Action to Reduce Ozone Levels
The governments of Hong Kong, Guangdong and Macau launched a 3-year study on “Photochemical Ozone Pollution in Greater Bay Area and Characterization of Regional and Super-Regional Transportation of Ozone” in 2021. Since the level of ozone concentration remained high in 2021, CAN expects the study, which will be completed in 2024, to not only find out the origins of ozone, but also outline action plans to reduce ozone levels.