2020 Annual Air Quality Review
NO2 and Ozone Still at a High Level Despite of Air Quality Improved
Clean Air Network analysed the 2020 air quality data from the Hong Kong Environmental Protection Department (EPD) and the main results are listed below:
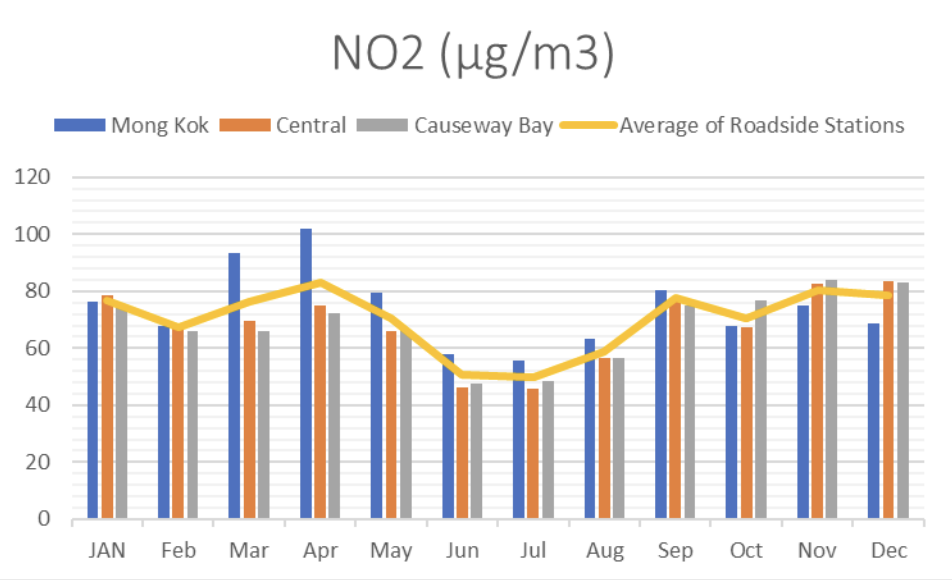
1. Annual average concentrations of major air pollutants decreased Roadside NO2 still exceeded WHO guidelines and HKAQO by 175%
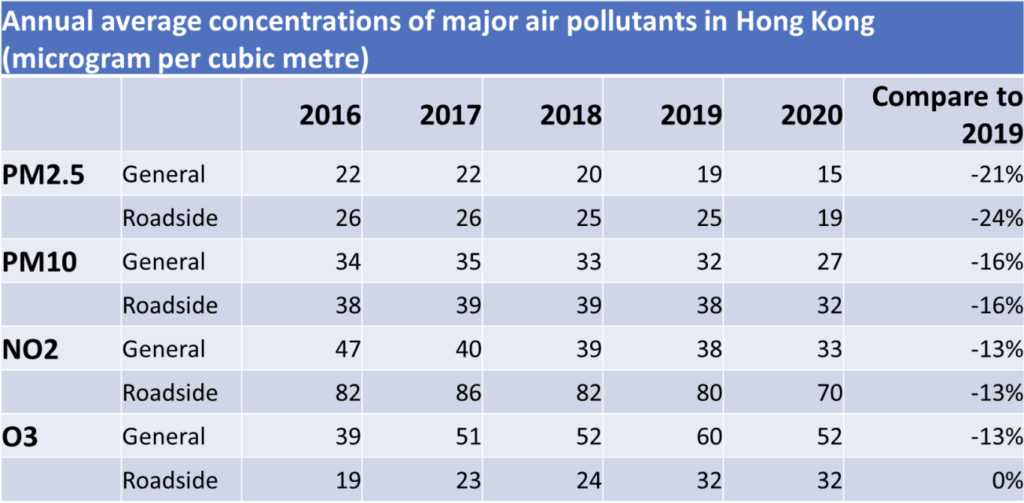
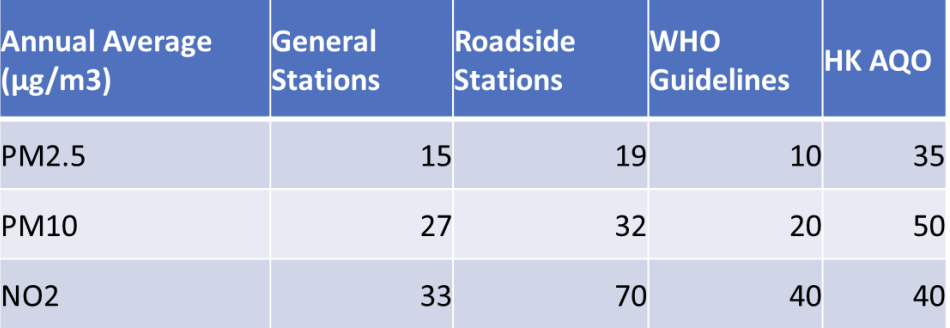
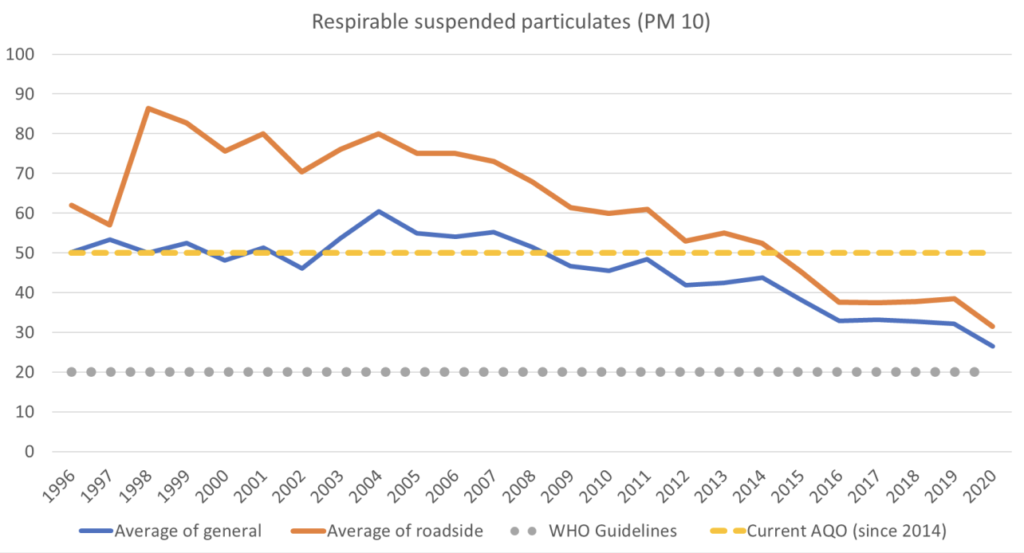
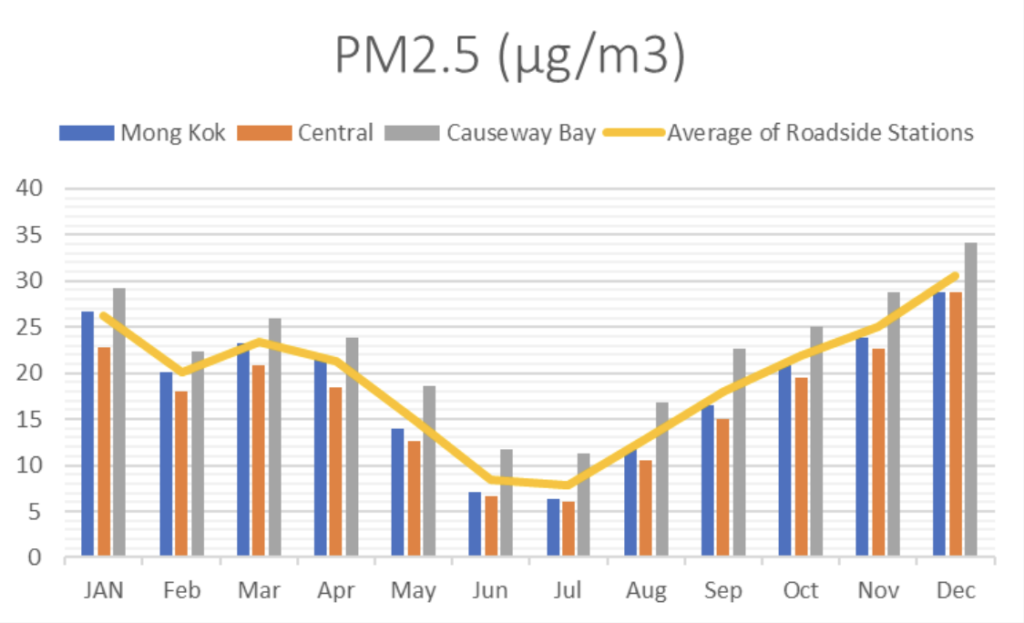
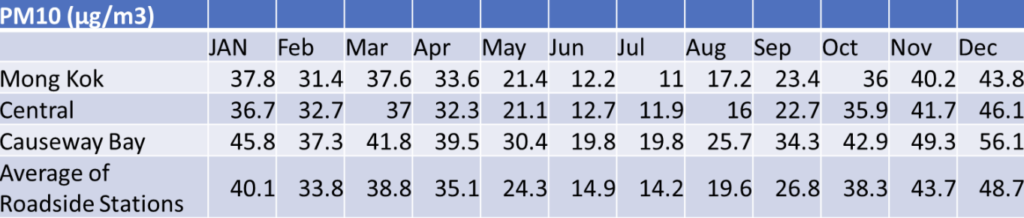
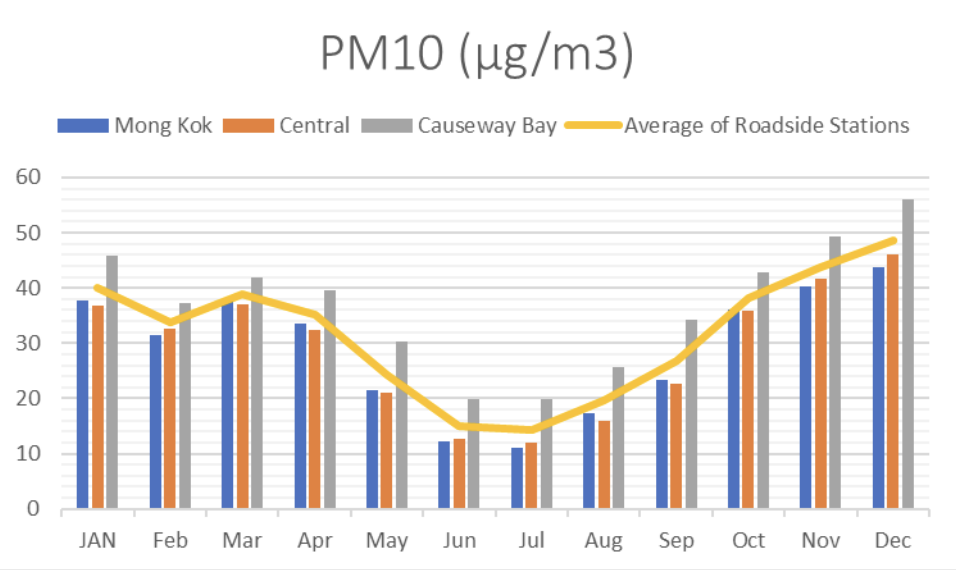
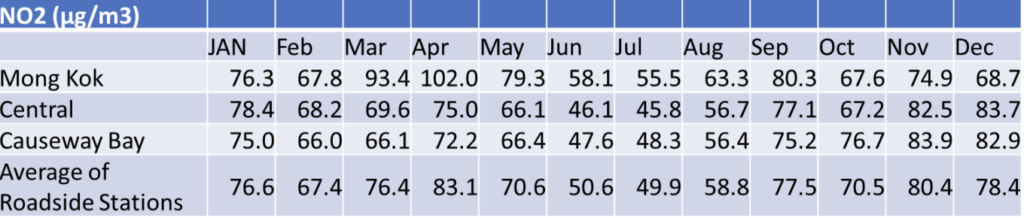
The annual average concentrations of major air pollutants, including respirable suspended particulates (PM10), fine suspended particulates (PM2.5) and nitrogen dioxide (NO2) in 2020 had been reduced compare to 2019, by the lowest 13% to the highest 24%. Although annual average concentration of roadside NO2 declined 13% compare to 2019, it was still at a high level, which was 70 µg/m3, exceeding the World Health Organization (WHO) guidelines and Hong Kong’s Air Quality Objectives (AQO) limit (40 µg/m3) by 175%. Annual concentrations of NO2 of all roadside stations exceeded the WHO and AQO limit. Mong Kok roadside station recorded the highest level (74 µg/m3), exceeding the limit by 185%. Causeway Bay and Central recorded 68 µg/m3, exceeding the limit by 170%.
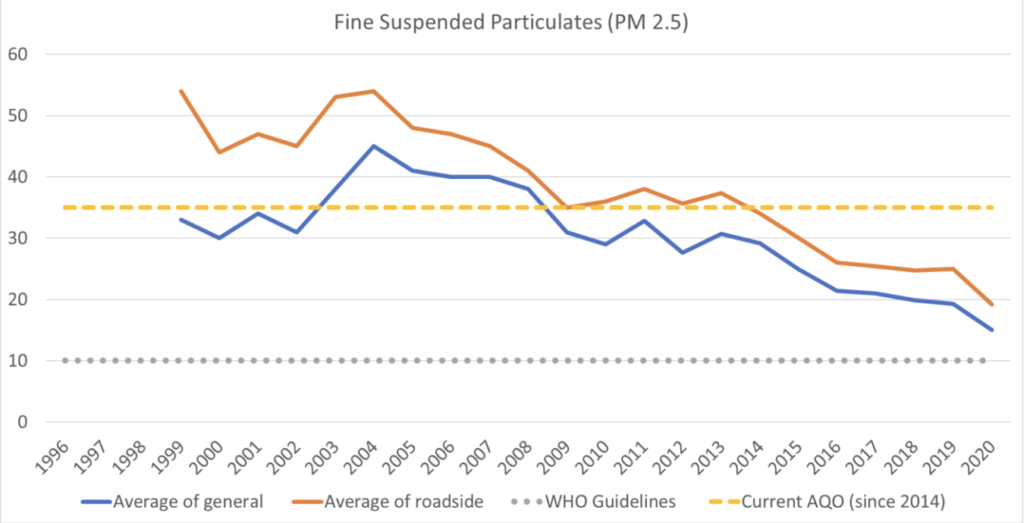
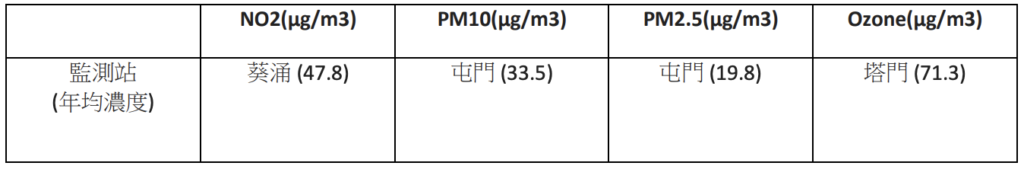
The annual average concentrations of NO2 at general stations met the standards of WHO and AQO. However, Kwun Tong, Sham Shui Po and Kwai Chung’s annual concentrations exceeded the limits, which was 43 µg/m3, 45 µg/m3 and 48 µg/m3 respectively. More attention should be paid for these areas. For PM2.5 and PM10, although their annual average concentrations in 2020 met the AQO limit, they still could not meet the WHO guidelines (10 µg/m3 and 20 µg/m3). The HKSAR government should strengthen the measures to tackle with air pollution and improve air quality.
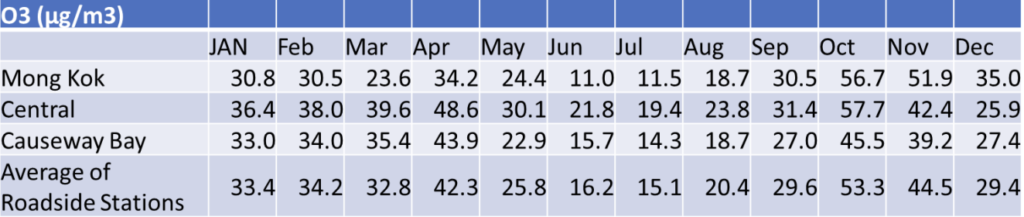
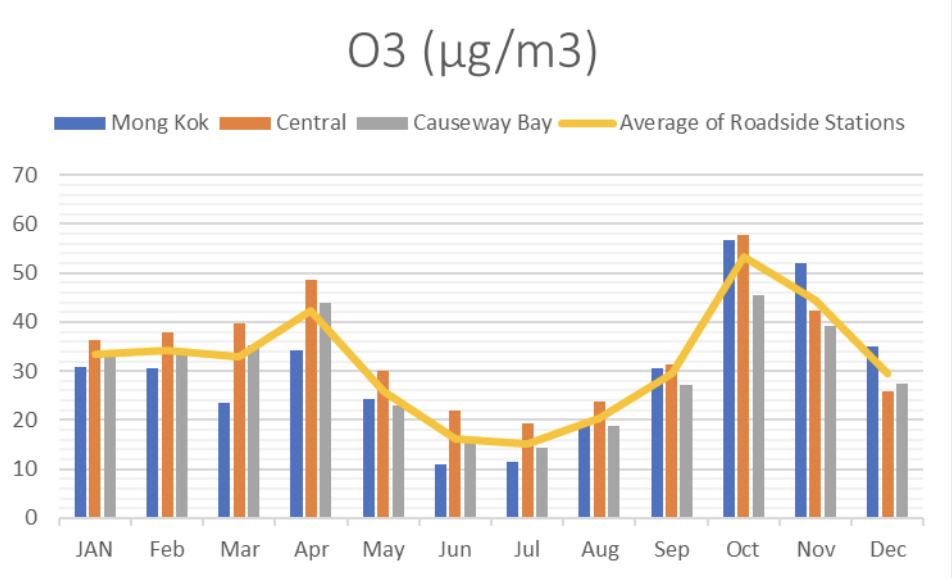
2. Roadside Ozone stayed at the highest level since record
The annual average concentration of Ozone (O3) last year was still at an alarming level. Despite a slight drop of the annual average of general stations, the roadside stations still remained at the highest level since record (2011), 32 µg/m3, same level as 2019. According to WHO guidelines, the limit of O3 for 8 hours average is 100 µg/m3. Under Hong Kong’s AQO, the concentration limit of O3 is 160 µg/m3. Number of exceedances allowed is 9 times. Based on EPD’s data, 5 general stations recorded exceedance more than 9 times, including Tuen Mun (11), Tung Chung (11), Tai Po (14), North (10) and Tap Mun (17).
The government has not developed an effective strategy for combating the skyrocketing level of ozone. As a result, Ozone level has been on a long-term upward trend for the past 20 years. Compare to 1999, the annual average concentration of Ozone at general stations in 2020 increased by 53%. While roadside Ozone increased by 146% compare to 2011.
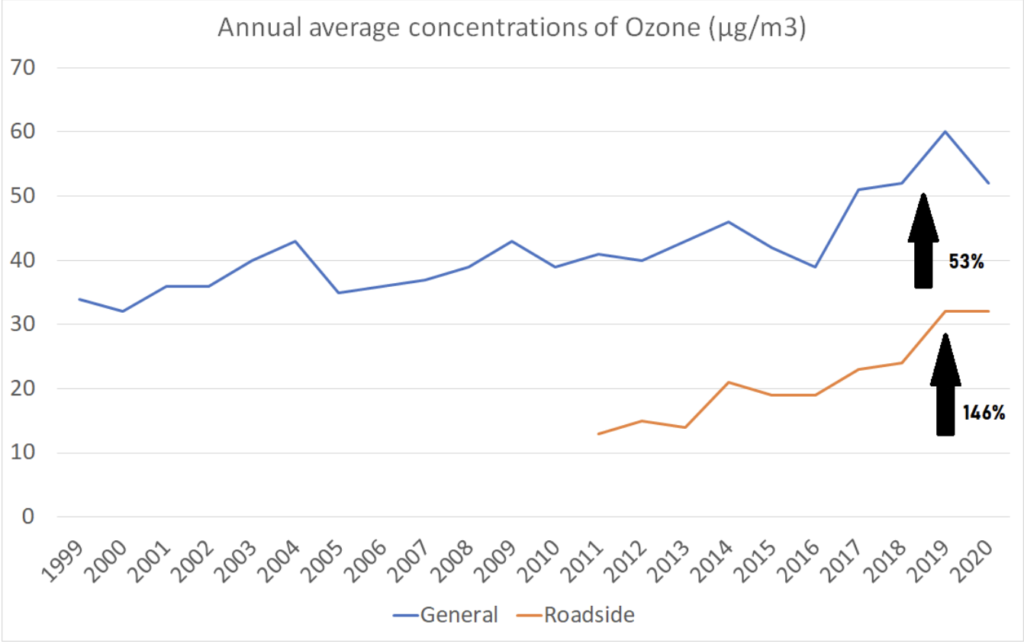
Ozone is a secondary pollutant formed by a series of complex photochemical reactions mainly involving nitrogen oxides (NOx) and volatile organic compounds (VOCs). The government should investigate the reason why the level of ozone in Hong Kong and the surrounding region has been skyrocketed in recent years and make a concerted effort to control the level of NOx and VOCs in the region.
3. Less traffic and air pollution due to working from home during COVID-19
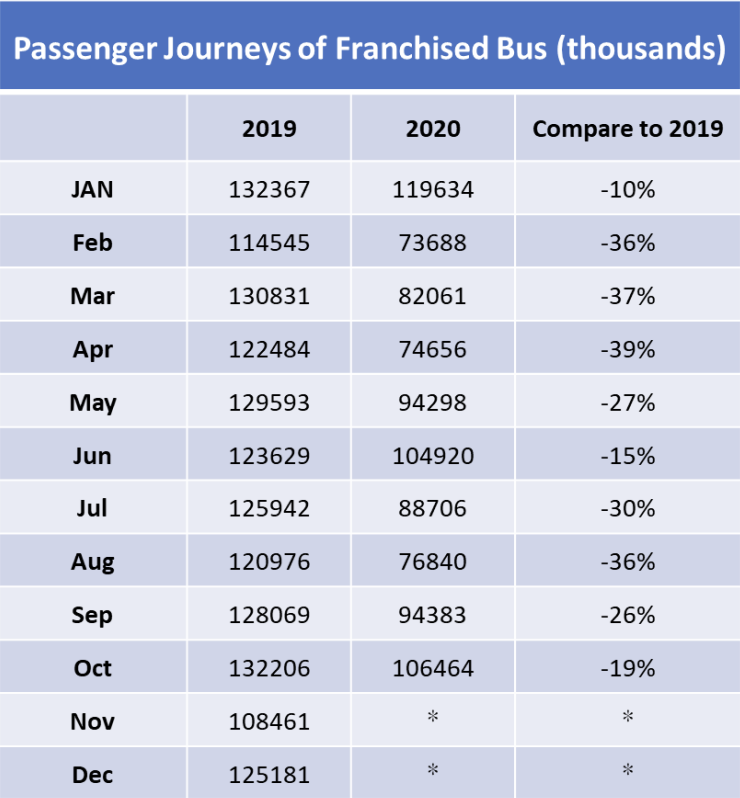
Since the first infected case of COVID-19 appeared since January 2020, Hong Kong has experienced 4 waves of major outbreaks, from late January to mid-February, midMarch to April, June to August and November until now. During the major outbreaks, the government and some private enterprises allowed their employers to work from home. Face to face lessons at schools were also suspended. Due to a drastic drop in passenger demand, franchised bus operators reduced their services of some routes. For example, during 27th July to 2nd August 2020, Transport Department allowed bus operators to adjust the service frequency of 284 routes. According to Transport Department’s data, the monthly passenger journeys of franchise bus declined from 10% to 39% compare to 2019. The average passenger journeys of the first 10 months in 2020 declined by 27% compare to same period in 2019.
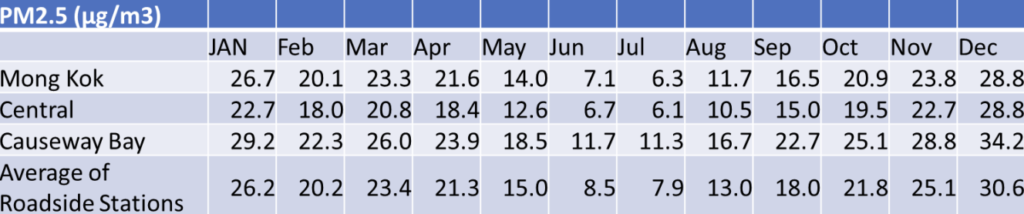
Compare the monthly data of roadside stations with the timeline of COVID-19 development in Hong Kong, the period with obvious drop of pollution level was align with the time of major outbreaks. It is possible that due to COVID-19 effect, bus services were less frequent which helped alleviating the traffic and roadside pollution.
4. Tuen Mun remained as the most polluted district
In 2020, the most polluted general station was Tuen Mun, same ranking as 2019. It recorded the highest annual average concentrations of PM10 and PM2.5. The highest annual average concentrations of NO2 and O3 were recorded in Kwai Chung and Tap Mun.
Policy Recommendations
Under the threat of COVID-19, working environment and commuting patterns had been changed in 2020. Working from home reduced the traffic and thus alleviating air pollution in Hong Kong. However, improvement of roadside pollution was limited, levels of Ozone and NO2 were still alarming and more effort should be paid on lowering their concentrations.
Clean Air Network urges the government to implement the following measures:
1. Formulate ambitious roadmap to transform franchised bus fleet and other commercial vehicles to zero emission
Include franchised buses and other commercial vehicles in the first EV Roadmap to be announced in Q1 this year. The Roadmap should also indicate the infrastructure development goals and the timeline to ban all internal combustion engine vehicles.
2. Strengthen Control over Ozone
CAN urges the Guangdong and HKSAR Governments to complete the study “Characterization of photochemical ozone pollution in the Greater Bay Area and its regional and super-regional transportation” as soon as possible and propose policy measures to minimize worsening of ozone within 3 years.
3. Update Hong Kong’s AQO and cancel the number of exceedances allowed of 35 times
The current AQO has been in use since 2014. However, Environment Bureau has to wait until second half of 2021 to introduce an amendment bill to the Legislative Council for promulgating the new AQO. Also, the number of exceedances allowed for PM2.5 will increase from 9 to 35 times. CAN urges the government to finish the draft of amendment bill as soon as possible and introduce to the Legislative Council within the first half of this year. Moreover, the number of exceedances allowed for PM2.5 should remain the same as 9 times.
4. Strengthen Exposure Control to Minimize Health Risk
We recommend the HKSAR Government to establish territory-wide exposure-based target as the success indicator of policy measures. To better control public exposure to health risk, we urge the HKSAR Government to implement district-specific policy measures, including to extend the Low Emission Zones to cover highly affected districts, such as Sham Shui Po, Kwai Chung and Tuen Mun. In parallel, we urge the HKSAR Government to tighten the emission standards of Low Emission Zones to allow only Euro VI, hybrid or electric buses to operate. The HKSAR Government should formulate a plan to regulate other types of vehicles from entering the Low Emission Zones at designated time.