Policy Change
Under our ongoing advocacy work, the Government has in the past years:
- Amended the principal air pollution control ordinance to review Air Quality Objectives at least once every five years
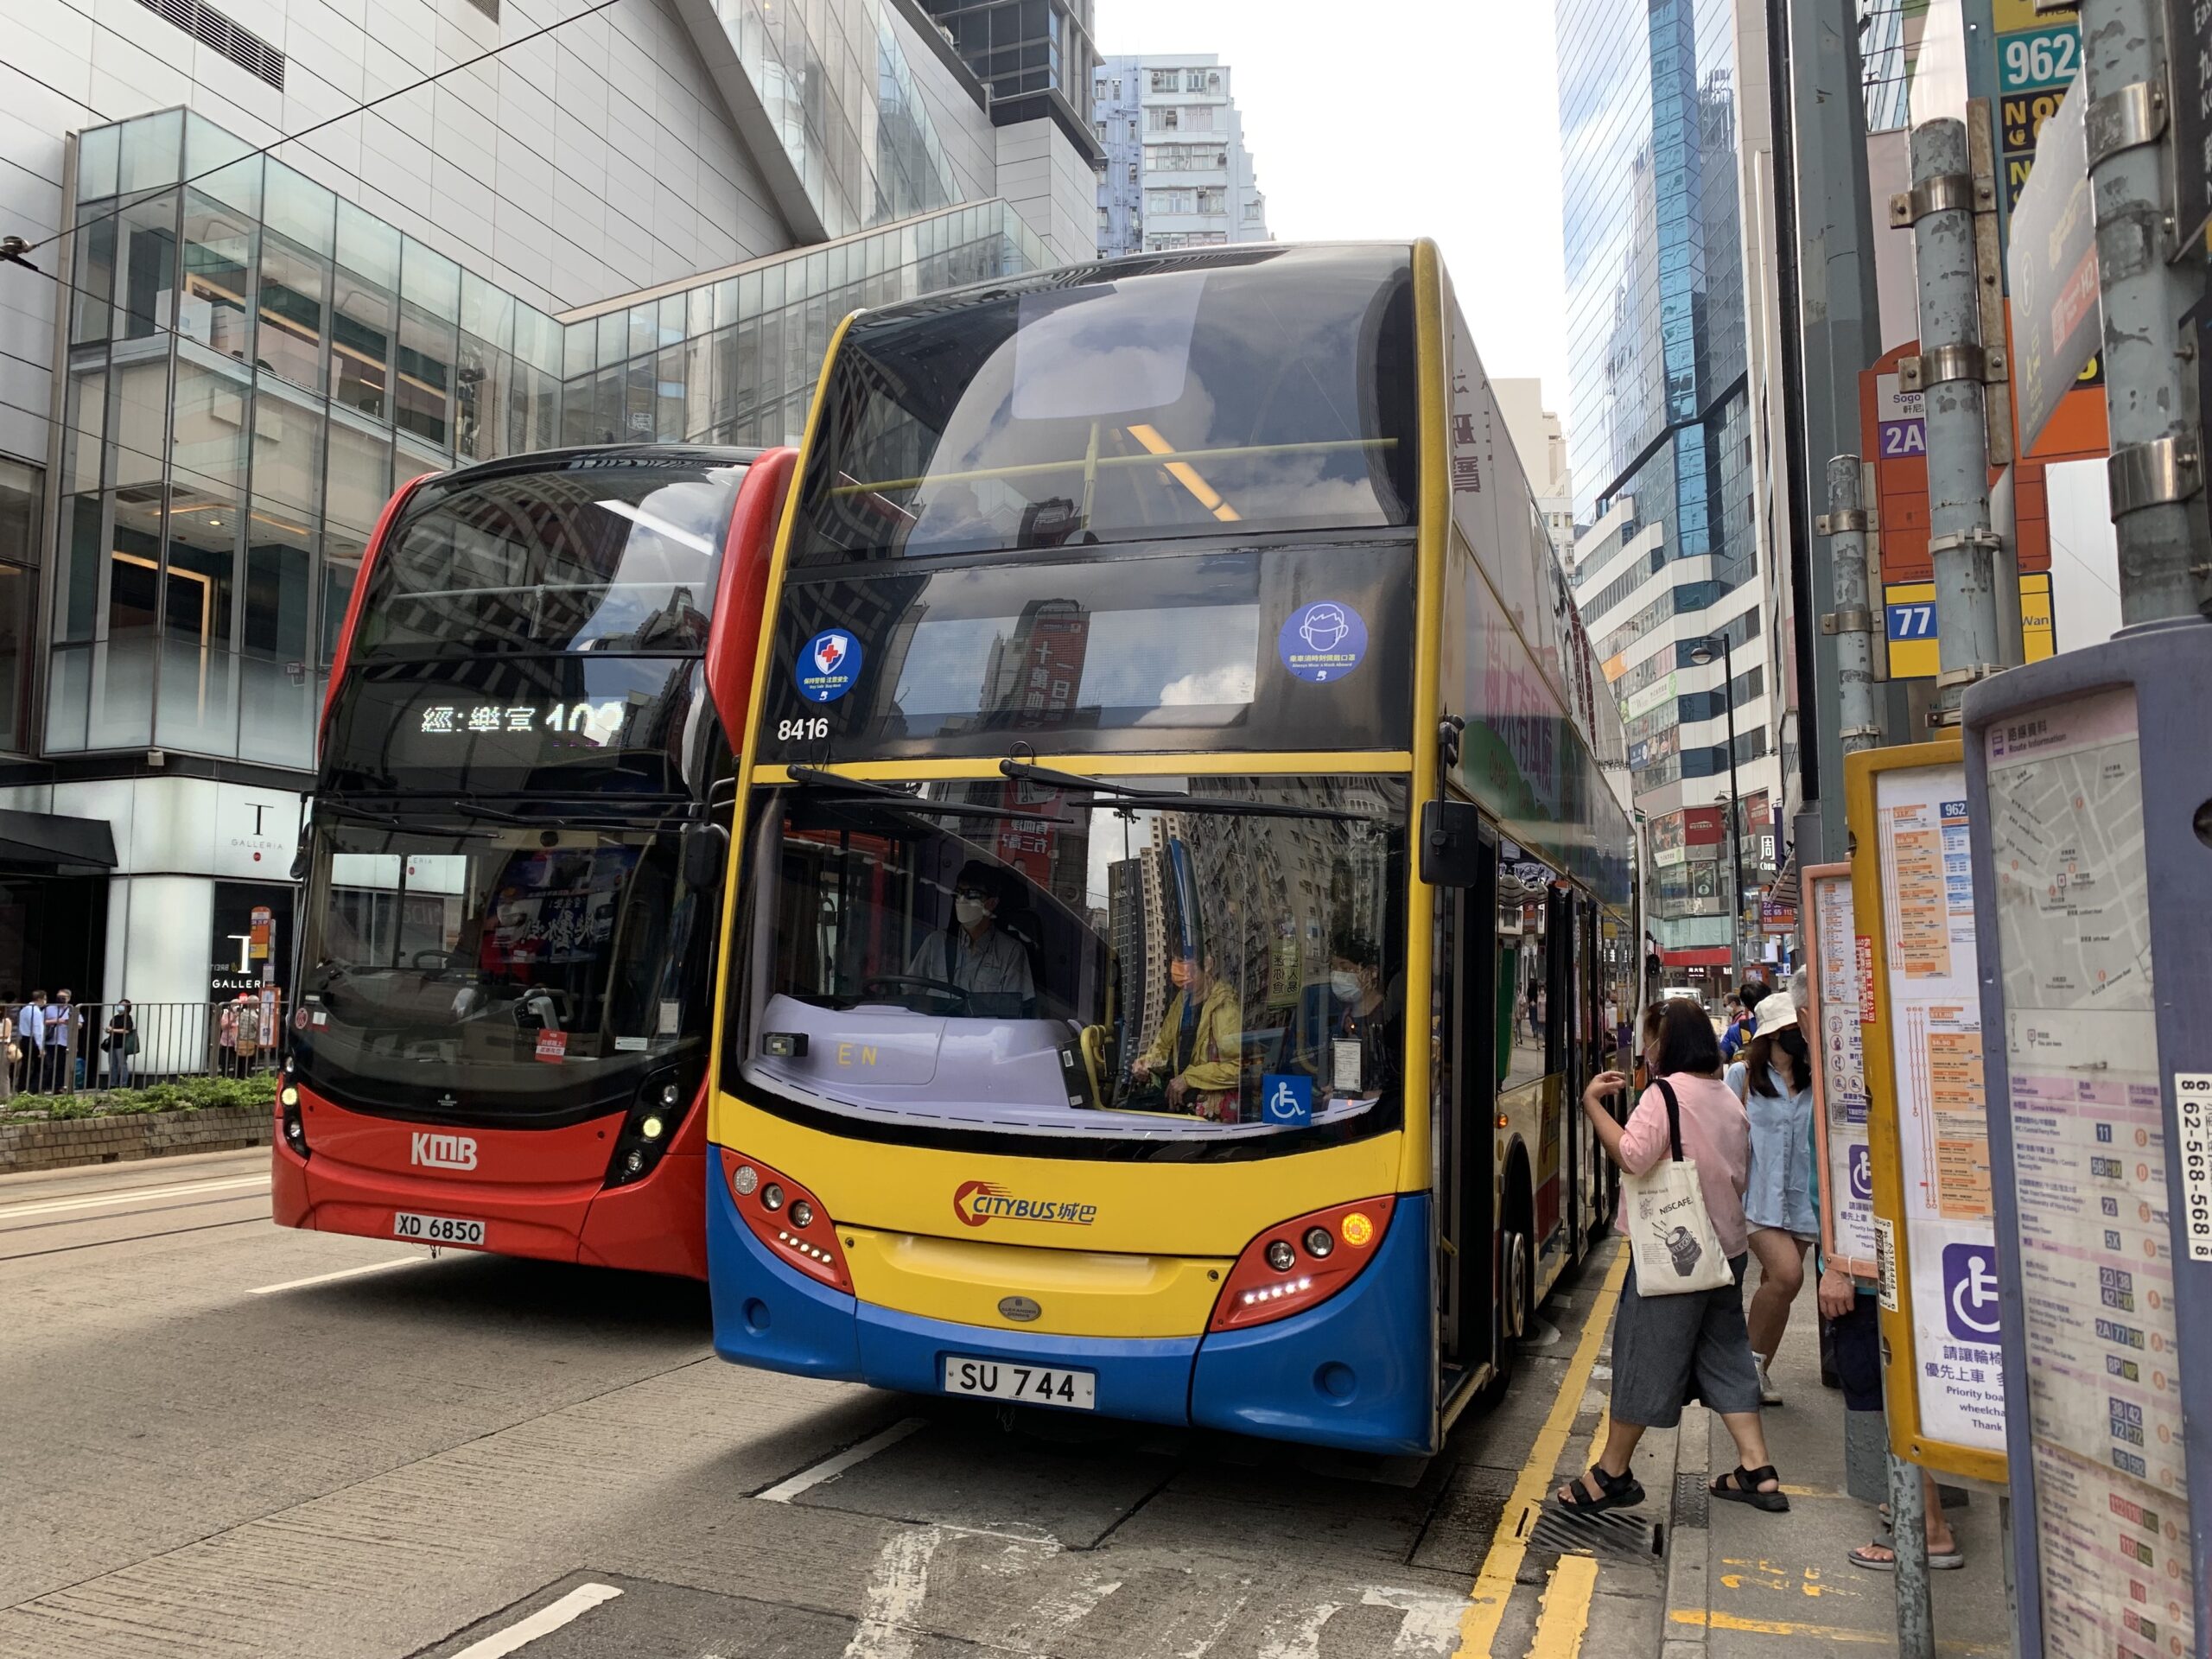
- Set up a 10–billion dollar fund to subsidize the replacement of old and polluting commercial diesel vehicles
- Mandated fuel switch at berth for ocean going vessels
- Commenced the first walkability study in Hong Kong
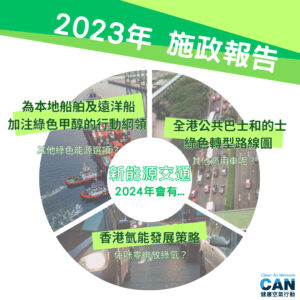
- Published the Clean Air Plan 2035 and the first EV Roadmap for Hong Kong, which
- Set out long-term strategy on air quality management and green transport
And the Government will
- Enhance air quality at public transport interchanges
- Update the Air Quality Health Index to show long-term and short-term health risks
- Commit to provide more detailed district–based air quality information to public
Knowledge Change
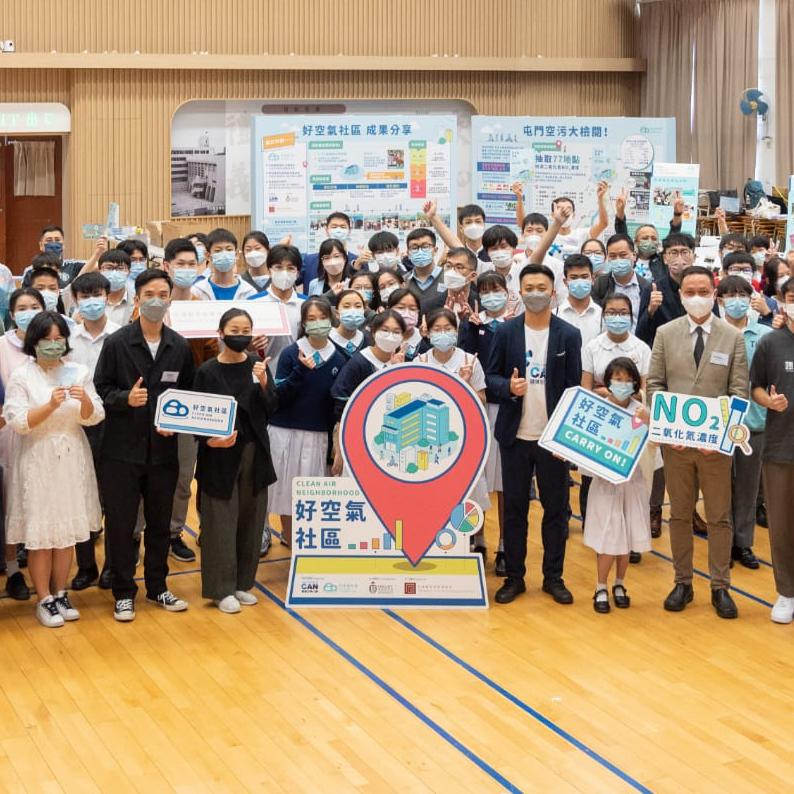
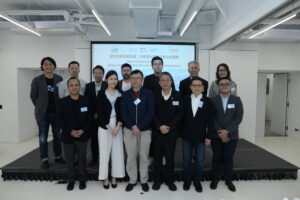
In the past 5 years, CAN has:
- Approached more than 20,000 individuals, including over 2,000 students in 100 secondary schools, more than 500 parents and volunteers, through our public empowerment programmes
- Maintained a strong local media presence
Now, the public understands a lot more about the health impacts of air pollution!
Air Pollution Reduced
Over the past 5 years, the annual average concentrations of major pollutants have been dropping:
| Air pollutant |
General stations |
Roadside stations |
| NO2 |
-8% |
-15% |
| PM10 |
-15% |
-8% |
| PM2.5 |
-35% |
-16% |
Societal Costs of Air Pollution Reduced
In the past 5 years,
- Number of premature deaths dropped by 29%
- Economic loss dropped by 30%
- Number of Clean Air Days increased by 37%