2019 Annual Air Quality Review
Summary
Clean Air Network analyzed the 2019 air quality data from the Hong Kong Environmental Protection Department (EPD) and the main results are listed below:
1. Pollutants level by districts In 2019, the most polluted districts in 2019 were Tuen Mun, Kwai Chung and Tseung Kwan O respectively. Below shows the concentration of pollutants from the districts with the highest level of pollutants:
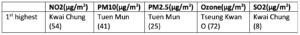
2. In general, air pollution in the western part of Hong Kong is more serious than in the eastern part. Except for ozone, all level of air pollutants is higher in the western part than in the eastern part of HK. Roadside air pollution is still prominent, with the level of Nitrogen Dioxide (NO2) and Fine Suspended Particles (PM2.5) higher than the WHO level by 1.95 times (79μg/m3) and 2.5 times (25μg/m3) respectively.
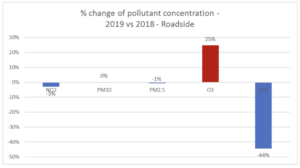
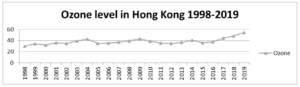
3. Compared with 2018, the level of ozone in 2019 increased significantly by 11- 25% (see slides 7-9 for details). The level of ozone in roadside stations increased tremendously by 25%.
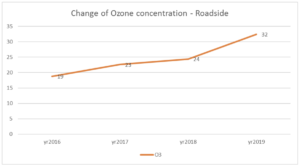
4. The level of ozone is the highest for the past 4 years (2016-19), with the western part of Hong Kong and roadside stations have shown a larger portion of increase (see slides 10-14 for details). Improvement of roadside PM2.5 and NO2 has been stagnant for the last 3 years, returning to the level in 2016.
Analysis
1. Roadside pollution is still a major health threat to Hong Kong in 2019. The roadside level of pollutants NO2 and PM2.5 were higher than the WHO level by 1.98 times and 2.5 times respectively. For the past 5 years, the level of NO2 has shown a decreasing trend, reflecting the impact of roadside emission reduction programs led by EPD, but still far away from a healthy standard from a public health point of view.
2. The level of ozone has shown an unstoppable increase in 2019 to reach the highest level (54μg/m3) since 1998. The increase of ozone level is more significant in the western part of Hong Kong, reflecting a possible increasing polluting impact of regional influence. The level of PM2.5 and PM10 of Tuen Mun is highest in Hong Kong in 2019, which probably shows a combined effect of nearby power plants, traffic emissions and regional pollutions.
3. The government seems not developing an effective strategy for combating the skyrocketing level of ozone. Ozone is a secondary pollutant formed by a series of complex photochemical reactions mainly involving nitrogen oxides (NOx) and volatile organic compounds (VOCs). The government should investigate the reason why the level of ozone in Hong Kong and the surrounding region has been skyrocketed in recent years and make a concerted effort to control the level of NOx and VOCs in the region.
A review on “A Clean Air Plan for Hong Kong” “A Clean Air Plan for Hong Kong” (the Plan) has officially come to an end in 2019. The government published the progress report in 2017, but the focus was merely on whether the proposed policies had been implemented on schedule, rather than whether the Plan can effectively enhance public health. In light of this, Clean Air Network proposes three indicators to look into the effectiveness of the Plan, namely
1. The level of air pollutants (which is utilized in the government’s progress report);
2. The change of emergency admissions for the cardiovascular and respiratory disease after the implementation of the Plan;
3. Whether the implementation of AQHI can effectively enhance public health.
According to the latest research by a team of HKU School of Public Health [1], the AQHI introduced by Clean Air Plan do not have a significant impact on reducing the rate of emergency admissions for cardiovascular diseases for the elderly in Hong Kong (see more at slides 21-22). Similar research by the same team says the introduction of AQHI fails to reduce the rate of emergency admissions for respiratory diseases for both the elderly and children [2]. The reason for the government to introduce AQHI is hoping to change the behaviour of individuals with substantial health risks during high pollution episodes and reduce their exposure to air pollutants. However, the researches by HKU School of Public Health seem to suggest that the policy intervention by introducing AQHI has no statistically valid impact on the change of emergency admissions for both diseases.
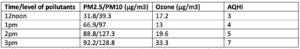
The design of the reporting system by AQHI is also too biased to the level of ozone in the atmosphere. According to a report commissioned by EPD [3], the value of AQHI is largely “determined” (over 50%) by the level of ozone rather than by other pollutants which has a higher health impact (e.g. PM2.5 only “weighs” 17%). Clean Air Network analyzed the change of levels of air pollutants with respect to the change of level of AQHI in 2019/12/22. The findings below support the observation that AQHI is designed to be biased towards the change of level of ozone.
For instance, in Central and Western District, the level of PM2.5 and PM10 doubled (110% and 147%) from 12 pm to 1 pm while AQHI only slightly increased from 3 to 4 (from “Low” to “Moderate”). However, when the level of ozone increased less than double (70%) while the level of PM2.5 and PM10 was about the same, AQHI largely increased from 5 to 7 (from “Moderate” to “High). The current design of AQHI may underestimate the health impact of high pollution episodes where the level of PM2.5/PM10 is relatively high and the level of ozone is relatively low.
2019/12/22
To further illustrate the “weighting” problem of AQHI, Clean Air Network analyzed and compared the data for all monitoring stations in 2019. It is found that the correlation coefficient between PM10 and AQHI, and PM2.5 and AQHI are 0.71 and 0.68 respectively. The correlation coefficient between ozone and AQHI is lower, which is 0.67 (see slides 23). The data shows that the change of AQHI is more related to the change in the level of PM10 and PM2.5, rather than the change of the level of ozone.
In sum, the level of air pollutants generally decreases. However, the level of ozone strikes 20-year high, and the Plan fails to pass the other two indicators on the change of emergency admissions of air-pollution related diseases and the effectiveness of AQHI to improve public health.
Policy Suggestion
The government should formulate a new Clean Air Plan as soon as possible. Clean Air Network has the below suggestions upon what should be included in the Plan:
1. Introduce bold measures and policies to curb roadside air pollution, such as full electrification of public transport fleet;
2. Set up a clear timeline on how emission reduction transforms to the improvement of public health, such as to introduce the target of roadside NO2 and PM2.5 level, and to include the emergency admissions of cardiovascular and respiratory diseases as policy objectives;
3. Set up targets for Bureaus and ensure cross-bureau collaboration, such as the total mileage by cars by the Transport Bureau, the indicators of emergency admissions by Health Bureau, and the better implementation of AQHI to enhance behavioural change of high-risk populations by Environment Bureau.
Attached: 2019 Air Quality Review
Reference
[1] Mason, T. G., Schooling, C. M., Ran, J., Chan, K. P., & Tian, L. (2020). Does the AQHI reduce cardiovascular hospitalization in Hong Kong’s elderly population?. Environment International, 135, 105344.
[2] Mason, T. G., Schooling, C. M., Chan, K. P., & Tian, L. (2019). An evaluation of the air quality health index program on respiratory diseases in Hong Kong: An interrupted time series analysis. Atmospheric Environment, 211, 151-158.
[3] http://www.aqhi.gov.hk/pdf/related_websites/APIreview_report.pdf, p.40